


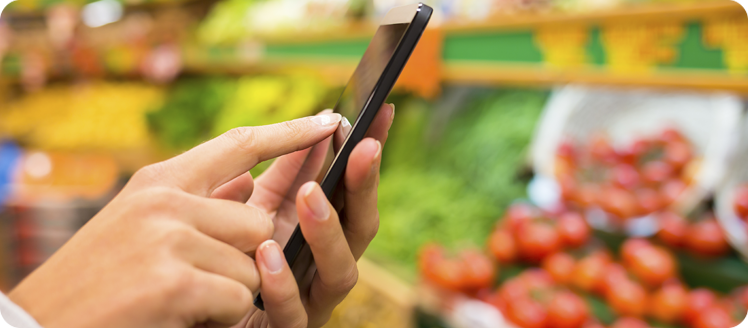
More and more, consumers are Googling food brands they hear about and shopping online.
Here are 10 very vital statistics having to do with marketing food & beverages to increasingly health-conscious buyers in the digital age.
- In 2014, around 4% of U.S. grocery sales ($27 billion) were through e-commerce.
- By 2023, it’s predicted to be 17%.
- $400 billion is spent on snacks each year worldwide.
- 41% of Americans who buy groceries online do it once a month, 23% do it twice monthly, and 36% do it three or more times every month.
- American households with incomes of $75K or more account for 43% of all U.S. grocery sales.
- For food brand websites, SEO is still the best source for delivering visitors: 56% of all traffic to U.S. food brand websites is generated by search engines, compared to 19% via direct traffic, 15% via referral, and 9% via social media.
- For beverage brand websites, 47% of all traffic is generated by search engines, compared to 29% via direct traffic, 17% via referral, and 6% via social media.
- 70% of millennials shop for foods at specialty retailers that sell a wide variety of health foods.
- 76% of consumers worldwide are willing to pay more for foods that promote better health.
- 41% of consumers worldwide plan on buying “more fruit” in the next six months, 39% “more vegetables,” 25% “more seafood,” and 24% “more yogurt.”
The growing importance of healthier eating among consumers of all ages, the increasing amount of groceries being purchased online, and SEO—all critical trends to pay attention to.